Materiality for the Ricoh Group
Ricoh Group’s Management Strategies and Identification of Material Issues
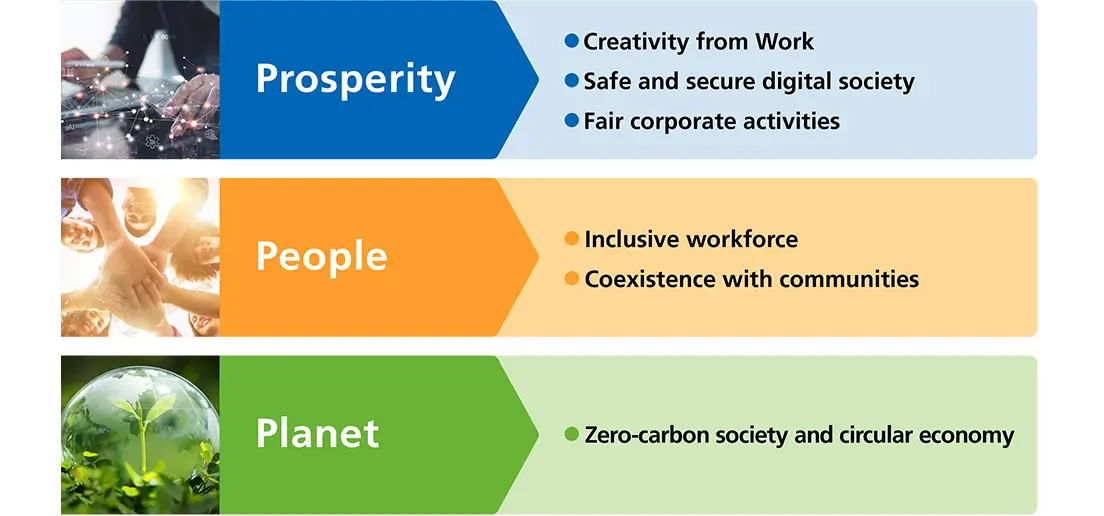
For the Ricoh Group, an ideal sustainable society is one in which the Three Ps Balance—balance between Prosperity, People and Planet is maintained. In order to create such a society, we will work to solve social issues through business based on the material issues identified by reflecting Ricoh’s Mission Statement, Mid-Term Management Strategy and expectations of our stakeholders, which are reviewed and set in conjunction with the formulation of our Mid-Term Management Strategy.
Six Material Issues
<Mid-Term Management Strategy ’26(Fiscal 2026-2030)> Materiality and ESG targets
| Materiality | Social Issues | Global ESG Targets | |||
|---|---|---|---|---|---|
| Indicators | Fiscal 2026 Targets | Fiscal 2030 Targets | |||
| Prosperity (Sustainable economy) | Creativity from work |
Boosting productivity/Unleashing creativity/ Digital inclusion |
①Customer survey scores*1 |
|
|
| Accelerating innovation | ②Co-creation projects, as % of total projects*3 | 43% |
Not disclosed. Only the current fiscal year’s targets are disclosed. |
||
| Safe and secure digital society | Information security and customer privacy | ➂Security management maturity*4(Progress toward FY30 Target) | 80% | ||
| Ethical technology development and utilization | ④YoY growth in technology assessment*5 personnel | 30% | |||
| Fair corporate activities | Respect for human rights | ⑤% of Ricoh group companies assessed as low risk*6 | 50% | ||
| ⑥Number of high-risk suppliers*7 | 0 | ||||
| Ensuring business ethics and compliance | ⑦Compliance maturity*8 | Average 3.0pt | |||
| People (Sustainable society) | Inclusive workforce | Employee engagement and inclusion | ⑧Engagement Score*9 | 3.96 | 4.14 |
| ⑨% of women in managerial positions |
Global 18.3% Japan 9.4% |
Not disclosed. Only the current fiscal year’s targets are disclosed. |
|||
| Employee skill development | ⑩Total number of digital skills at Level 2 or higher*10 |
13,200 (cumulative) |
|||
| Coexistence with communities | Building relationships with local communities | ⑪Employee participation rate in social contribution activities (cumulative basis) | 87% | ||
| Planet (Sustainable environment) | Zero-carbon society and circular economy | Climate change mitigation and adaptation | ⑫GHG*11 Scope 1and 2 reduction rate(vs. 2015) | 65% | 75% |
| ⑬GHG*11 Scope 3 reduction rate (vs. 2015) | 36% | 40% | |||
| ⑭Renewable energy, as % of total electricity use | 57% | 85% | |||
| Resource depletion/Resource circulation | ⑮Virgin material usage ratio of products | 76% or less | 60% or less | ||
-
*1Percentage of customers who evaluate the company as a “partner that supports problem-solving” through the value it provides, based on surveys aligned with regional strategies.
-
*2APAC: Asia Pacific
-
*3Ratio of projects involving co-creation with external organizations within the total number of R&D projects
-
*4Maturity assessment based on guidelines developed with reference to international standards and frameworks related to cybersecurity
-
*5Activities to anticipate and assess the social and ethical impacts of technologies from the planning and development stages, and to reflect risk mitigation measures in products and services
-
*6Percentage of group companies that have addressed all key items identified in the Ricoh Group human rights risk assessment
-
*7Number of suppliers with multiple non-compliant items against the requirements of the Ricoh Group Supplier and Partner Code of Conduct, which is based on the RBA Code of Conduct
-
*8A staged assessment of the extent to which employees’ awareness and systems (compliance framework) for complying with laws, internal regulations, and codes of conduct are embedded and functioning
-
*9Uses Gallup’s Q12 mean score (evaluation scores for 12 factors to predict high organizational performance)
-
*10Recommended digital certifications and skills defined by Ricoh for each talent category based on the IPA’s DX Skill Standard
-
*11GHG: Greenhouse Gas
<21st Mid-Term Management Strategy(Fiscal 2023-2025)> Materiality, ESG Targets, and Performance
Resolving social issues through business
| Materiality (Material issues) |
Focus Domains | ESG targets in 21st Mid-Term Management Strategy (End of Fiscal 2025) |
Fiscal 2023 Results | Fiscal 2024 Results | |
|---|---|---|---|---|---|
|
Creativity from Work |
|
(i) Customer survey scores*1 | 29% |
|
|
|
Community and Social Development |
|
(ii) Number of people to whom we have contributed by improving social infrastructure | 23.5 million people | 17.94 million people | 22.35 million people |
|
Zero-carbon Society |
|
(iii) GHG Scope 1 and 2 reduction rate (vs. 2015) | 50% | 47.4%*3 | 59.1% |
| (iv) GHG Scope 3 reduction rate (vs. 2015) | 35% | 38.1%*3 | 46.8% | ||
| (v) Renewable energy usage ratio | 40% | 31.0%*3 | 43.2% | ||
| (vi) Avoided emissions |
1,400 thousand tons |
1,059 thousand tons |
1,448 thousand tons |
||
|
Circular Economy |
(vii) Virgin material usage rate | 80% or less | 78.9% | 78.3% | |
-
*1The percentage of customers who evaluated us as a digital services company
-
*2A survey targeting solution customers in Latin America
-
*3Due to changes in organizational structure, the scope of disclosure has been revised and related figures have been recalculated.
Robust management infrastructure
| Materiality (Material issues) |
ESG targets in 21st Mid-Term Management Strategy (End of Fiscal 2025) |
Fiscal 2023 Results |
Fiscal 2024 Results |
|
|---|---|---|---|---|
|
Responsible Business Process |
(viii) CHRB score*4 | ICT sector leader | Self-assessment completed. 55% progress toward target | Self-assessment re-performed. 90% progress toward target |
| (ix) Compliance with NIST SP800 -171 Coverage of Ricoh’ s core business environment | 80% or more | Continued identification and assessment of information to be protected | Identification of information to be protected and formulation of a plan completed. Countermeasures partially completed. | |
| (x) Low-compliance risk group companies | 80% or more | Completed pulse survey for high-risk organizations | Improvement measures developed in the high-risk organization. Implementation partially completed. |
|
|
Open Innovation |
(xi) Contracted Joint R&D ratio | 25% | 23.0% | 22.7% |
| (xii) Digital service patent application ratio*5 | 60% | 54.7% | 64.6% | |
|
Diverse and Inclusive Workforce |
(xiii) Ricoh Digital Skills Level 2 or above rated employees (Japan) | 4,000 people | 2,855 people | 4,658 people |
| (xiv) Process DX Silver Stage-certified employee ratio*6 | 40% | 21.1% | 34.2% | |
| (xv) Engagement score *9 |
|
|
|
|
| (xvi) Female-held managerial position ratio |
Global:20% Japan:10% |
Global:16.5% Japan:7.7% |
Global:17.2% Japan:8.4% |
|
-
*4CHRB (Corporate Human Rights Benchmark) Score: An international human rights initiative established by institutional investors and NGOs. It evaluates global companies from five sectors: food and agricultural products, apparel, extractives, ICT manufacturing, and automotive manufacturing. (Approximately 250 companies evaluated as the latest benchmark)
-
*5Ratio of patent applications related to digital services business to total patent applications
-
*6Training rate of personnel with process improvement experience based on a Process DX model (Denominator is the total number of personnel in the training target organization of each business unit.)
Materiality Analysis
Materiality-specific process

STEP 1: Identifying Issues
In considering our mid-term management strategy, we assess the risks and business opportunities arising from changes in environmental and social trends—such as increasing demands to address climate change and human rights. At the same time, we evaluate the impact of our business activities on the environment and society, and identify key issues that require action.
STEP 2: Prioritizing Issues
Prioritize the identified issues based on international guidelines such as the SDG Compass, GRI standards, and the concept of double materiality, as well as management philosophy, management and business strategies, opinions from external stakeholders, and priority management risks in line with the risk management system. The drafts of materiality and ESG targets are then prepared.
Step 3: Management Decision
The materiality and ESG goals are deliberated and decided upon by the ESG Committee, which consists of the CEO as the Chairman, all Internal Directors, and Executive Officers. These decisions are made in conjunction with the financial goals of the mid-term management strategy and are approved by the Board of Directors before disclosure.
STEP 4: Performance Disclosure
Annual performance against ESG targets is disclosed annually by the ESG Committee, after confirmation with management.
Stakeholder opinions referenced
Individual meetings with shareholders/investors/analysts
Feedback from large IR meetings
ESG requests from customers during negotiations
Request in ESG evaluation systems
Opinions from internal stakeholders
Dialogues with external organizations such as JCLP and JCI
Reference Guidelines
SDGs Compass
GRI standard
European Guidelines on non-financial Reporting directive
Ministry of the Environment's Environmental Reporting Guidelines
TCFD
Ten Principles of the United Nations Global Compact
ISO26000
Relationship between executive compensation and ESG indicators
To clarify management's responsibility for ESG initiatives and achieving targets, we have incorporated ESG indicators into executive compensation since the fiscal year 2020.
Relationship to Executive Bonuses
By incorporating the "DJSI* Annual Ratings," which are used as a tool to monitor ESG
initiatives, into the performance-based bonus calculation formula for directors and executive officers, we provide
incentives for ESG initiatives. Furthermore, executive officers' compensation is also linked to ESG goals within
their areas of responsibility, enhancing commitment to achieving ESG targets in each business unit and group
headquarters.
* The Dow Jones Sustainability Index (DJSI) is a share index jointly developed by Dow Jones in the US and
S&P Global, a company specializing in research on sustainable investment, to measure the sustainability of major
companies around the world from the three perspectives of economy, environment, and society.
Relationship to Executive Stock Compensation
Starting from the fiscal year 2023, in addition to bonuses, we have introduced performance-based stock compensation with ESG targets for directors. The number of ESG targets achieved by the company is linked to the payment rate. Furthermore, this system will also be introduced for executive officers from the fiscal year 2024.
Approach to Materiality (Material issues)
The Ricoh Group’s policy is to “align ESG with business growth.” By leveraging our strengths, we will further drive business growth through our initiatives. We are pleased to introduce the Ricoh Group’s efforts to help resolve social issues through our business activities.