- Home
- Technology
- Ricoh's Technology
- A visualization method to detect indicators of emerging technologies
A visualization method to detect indicators of emerging technologies
In collaboration with the RIKEN Interdisciplinary Theoretical and Mathematical Sciences Program (iTHEMS), Ricoh developed an algorithm and a visualization method that enables indicators and critical junctures of emerging technologies to be detected from existing technical literature data. This technology is patent-pending.
Background
Recent years have seen a surge in the development of research methods that utilize data to comprehensively and quantitatively grasp global technological trends.
Traditional data analysis approach to understanding technological trends is to analyze the keywords described in patents, papers, and other technical documents. However, because this approach does not track changes in patterns over time, it is difficult to quantitively capture the indicators and critical junctures of emerging technologies.
Solutions
We have developed an algorithm that enables us to discern quantitative patterns of increase or decrease of keywords appearing in chronological data, as well as a method for visualizing these patterns, enabling us to extract new indicators and critical junctures in technological development from keywords appearing in patents, studies, and other technical documents.
Technical highlights
The technology consists of three steps.
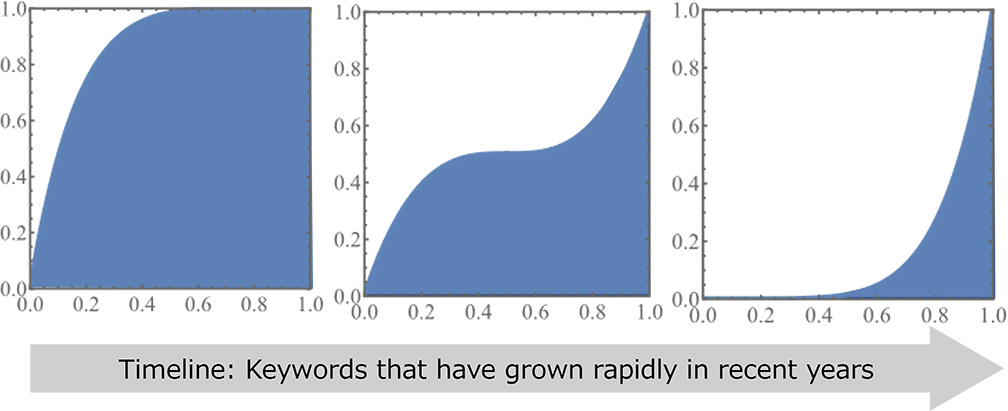
1. Determination of the level of a surge by calculating the area of a line graph
A line graph is created for each keyword contained in the technical literature, with the year of occurrence on the horizontal axis and the cumulative frequency on the vertical axis. By normalizing the values of each axis from 0 to 1 and calculating the area (the integral) of the graph, it is possible to identify increases that have occurred in recent years, rather than simply the frequency of occurrence of the keywords. For example, as the figure on the far right, the smaller the area, the greater the keyword's recent growth.
2. Pattern classification using the area of a squared function (second moment)
Because graphs with the same area can have different shapes, the patterns of increase can be distinguished by calculating the area (second moment) of the square function of a graph normalized from 0 to 1.
For example, the line graphs in the top row of the following figure all have the same area, but each has a different shape. To differentiate these shapes, we can classify the pattern of each graph by calculating the second moment.

3. Visualization by plotting
Each keyword can be plotted within an eye-shaped area in a map that takes the area value obtained in Step 1 on the horizontal axis (A1), and the value of the second moment calculated in Step 2 on the vertical axis (Ã2).
The horizontal axis of the map indicates when the technology emerged. As the map below shows, the keywords on the left show a pattern of rapid increase in recent years, while the patterns on the right show keywords that have appeared in the past but have not increased much since.
The vertical axis of the map indicates the pattern of increase, with the keywords at the top being those had that increased rapidly at a certain time but are not increasing much now (Vertical Type), while the keywords at the bottom are those that once lost momentum (stopped increasing) but have begun to attract attention again in recent years (Horizontal Type).
By plotting keywords extracted from technical literature on the map as shown, it is allows researchers to search efficiently for keywords that indicate indicators or critical junctures of emerging technologies.

- *
- This technology was developed in collaboration with Hideaki Aoyama, Visiting Principal Researcher, and Wataru Soma, Visiting Researcher of the Interdisciplinary Theoretical and Mathematical Sciences Program (iTHEMS) at RIKEN. This technology is useful for analyzing not only technical documents such as patents and studies, but also any type of chronological data.
Ricoh's vision
By conducting data-driven research using this technology, Ricoh will bring comprehensiveness and speed to its search for new topics at research institutes, thereby contributing to the search for emerging research themes and the creation of high-value intellectual property.

Related information
Sorted by : field “Sensing” “Analysis / Simulation”